Everyone who attended the 2014 SNAP conference will receive 50% off a 3 month subscription to Tailwind Lite $29/mo or Pro $99/mo. Enter the giveaway below for a chance to win the 2nd free 1 year subscription to Tailwind and get the 50% off discount code. Mandy from Sugarbee Crafts won the 1st Tailwind subscription! We will announce the 2nd winner and send the 50% off discount code to everyone who entered the giveaway on May 25th. You have until May 24th to enter to win!
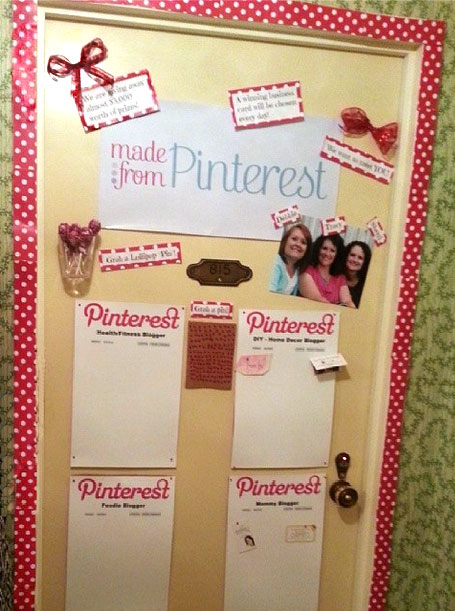
A big thank you to Scotch Brand for their wonderful adhesive products that allowed us to decorate our hotel room door, their adhesives are uh-mazing! Our decorations remained adhered to our door all weekend. We were able to remove the decorations without any damage or paint lifting off our hotel door.
Take a look at our Round 1 winners!
Free 1 year subscription to Tailwinds Pinterest Analytics Pro level ($1,188) Winner – Mandy Beyeler from Sugar Bee Crafts
1 Photography bag by Kelly Moore Winner – Melanie Artz from Artzty Creations
$150 Michael’s Gift Certificate Winner – Jessica Anderson from Cutesy Craft
1 Autographed “The Creative Gal Cookbook” Winner – Melissa George from A Prudent Life
2 Pin4Ever 1 Year Premium ($49) memberships Winners – Jessica Bailey from Pretty Providence and Cynthia Ann Jackson from Somebodylaughed.com
3 Darby Smart Wood Burning Craft Kits $19. Winners – Kendra Halterman from Me and My Insanity, Randi and Carol from FrugElegance and Dee LeBrilla from Cupcake and Crowbars
Some of you may not know about Tailwind and how their analytics can help you increase your Pinterest following. We feel the best way to teach you about Tailwind is to show you some our of stats for the month of March and how we used Tailwind to get to these numbers.
I am going to walk you through our routine for using Tailwind. There is too much information to share in one blog post, so I’m going to highlight the tools and data we use the most.
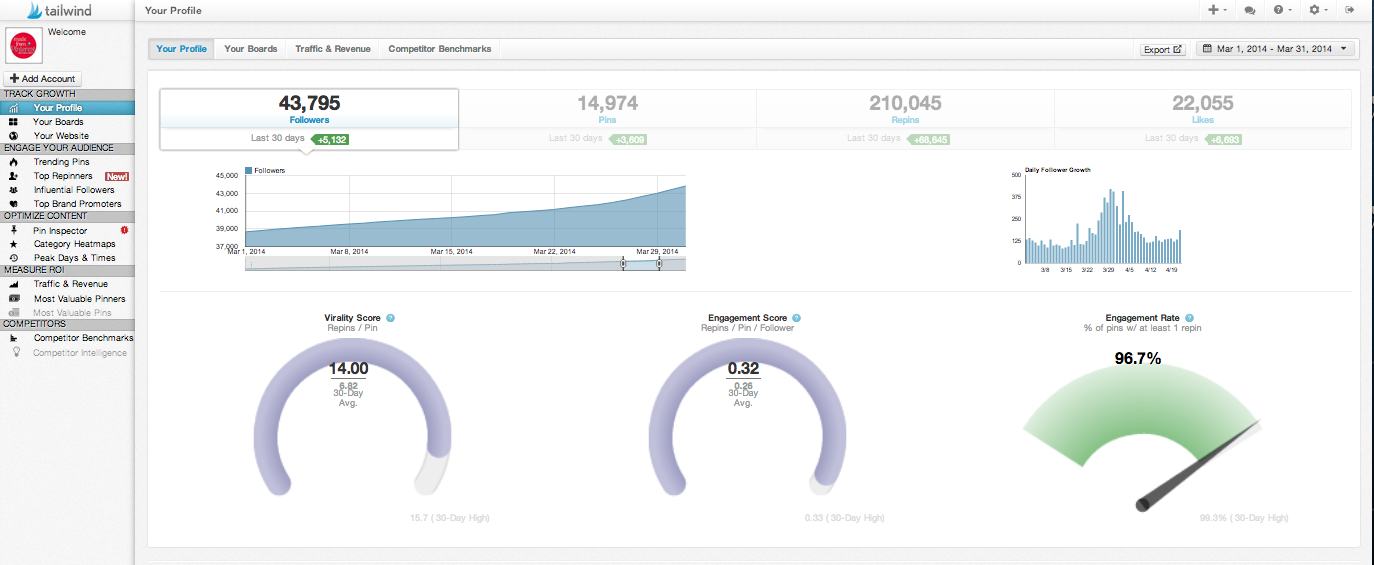
I start by checking our profile page to find out find how many new followers, pins and repins we have had on a daily, weekly and monthly basis. I have the ability to set any date range of my choice. The screen shot above shows our data for the month of March, but I usually choose the date range for the last 7 days.
A quick look at this page and I know that in the last month we have gained 5, 132 new followers, pinned 3,609 pins, had 68,645 repins and gained 6,693 likes. These are the kind of numbers I like to see!
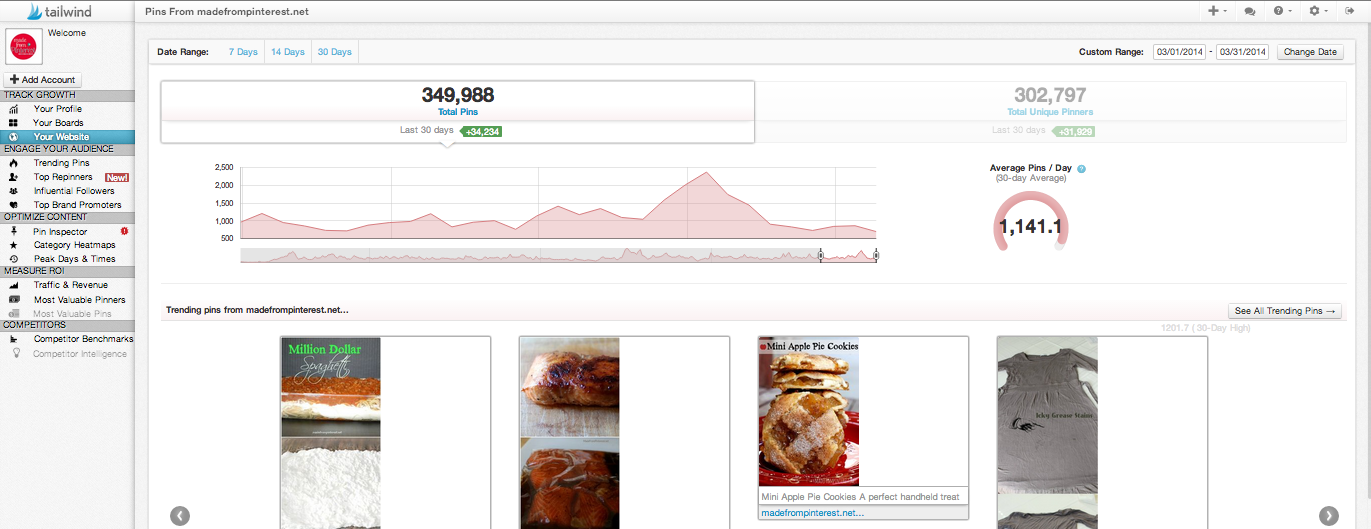
The next data I look at is how our website is doing.
This is where I find that for the month of March we had a total of 34,234 repins, 31,921 unique pinners. I can also see that the daily average number of pins that were pinned directly from our website to Pinterest was 1,141. I can also find our latest trending pins from our website. This is a great measurement tool that helps us know which of our posts are currently doing the well on Pinterest.
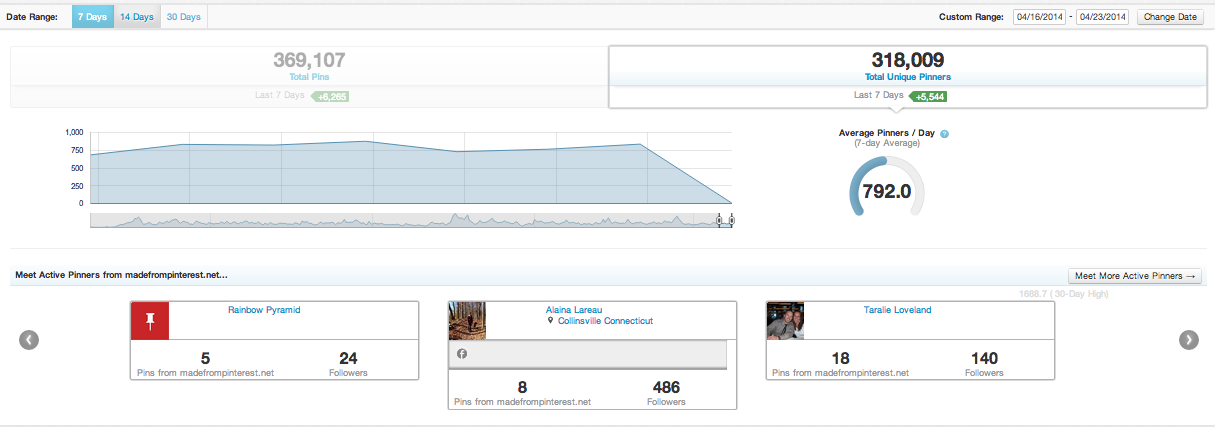
When I click on the Unique Pinners tab, it shows me how many unique pinners we have had for a specific time period, how many times they have pinned content directly from our site to Pinterest and how many followers they have. I can then go to their Pinterest account and interact with them by commenting on their pins and pinning their content to our boards.
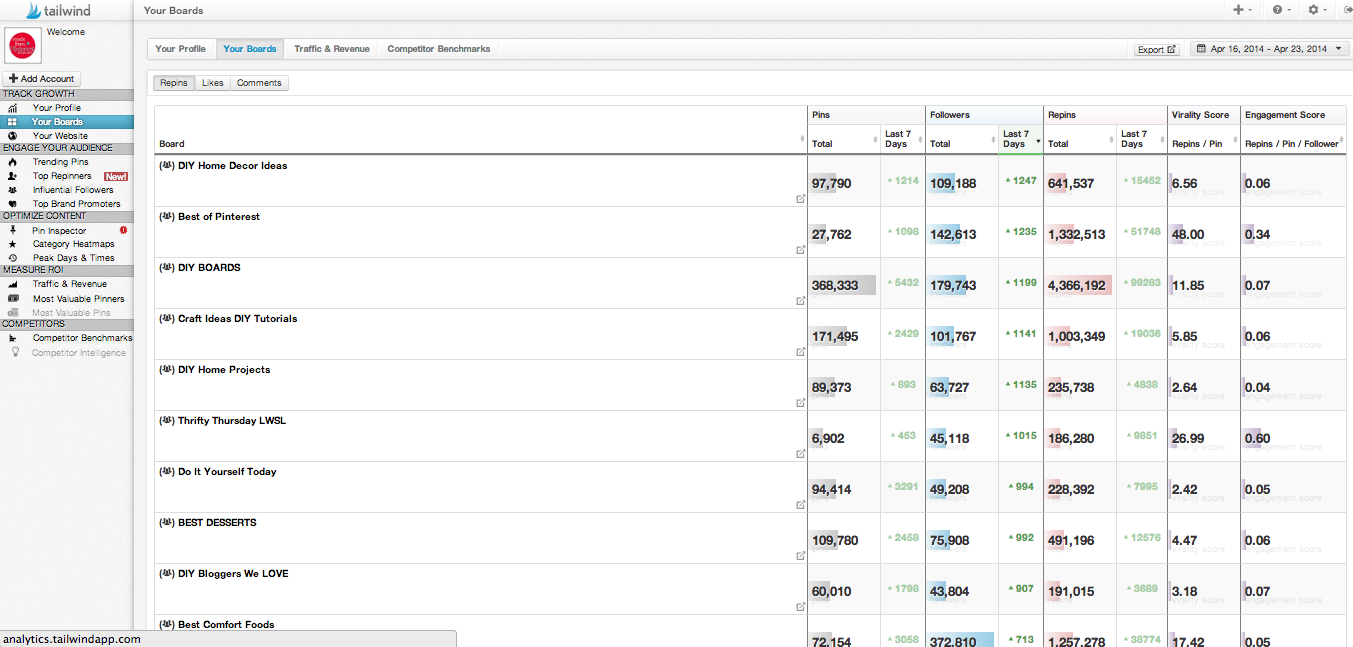
I then do a quick check on the Your Boards section, I can find a wealth of information that helps us pin our content in a very targeted manner. I can sort our boards to find out how many pins, repins and followers per board we have gained for any given date range. I can also see the Virality and Engagement score for each of our boards. This helps us keep track of which boards are doing well and see the boards that are not doing as well which means we need to spend some time building them up.
The category heatmaps give me visual view of our Pinterest categories which can then be broken down into specific boards. When I click on the food and drink category it breaks the category down into each of our food and drink boards. From the heatmap below you can tell that we pin to food and drink more than any other category by the size of the square. The darker the boards, regardless of their size, are the boards with the most viral content. This is critical information for growing your Pinterest following. Without it, you are to some extent flying blind.
Here is what it looks like when I click on the food and drink category, any board in that category shows up. This helps me know how each board in any given category is doing. We were surprised to find that some of our boards were not as viral as we expected them to be. We were even more surprised when we found out which board is our most viral board.
Before learning how to use our heatmaps we decided to clean up our account by getting rid of some boards we no longer wanted. We had a hard time deciding wether or not to keep the board Font Geek, we finally decided to keep it even if it didn’t gain new followers. I’m one of those people who LOVES fonts. Imagine our surprise when we learned to use our heatmap and found out that our little Font Geek board happens to be our most viral board! We began pinning new content to it consistently which resulted in a sizable consistent stream of new followers.
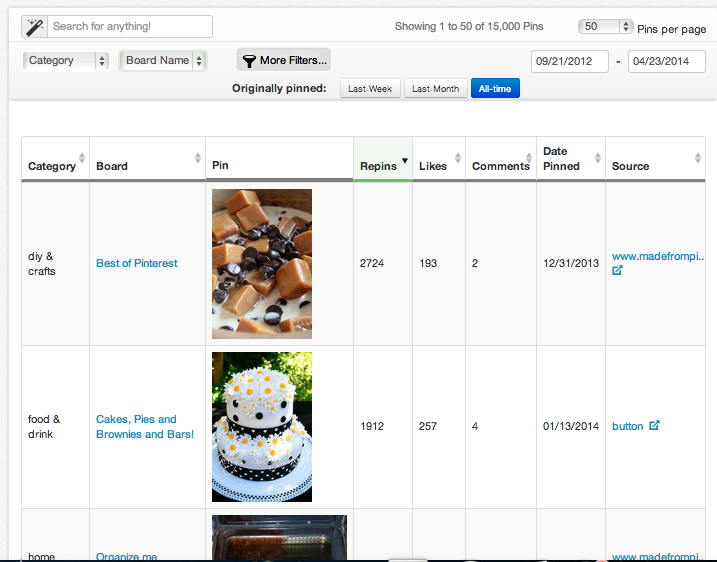
Pin Inspector is one of my favorite tools! I can choose any pin from our account and find out the source of the pin, the date it was pinned, how many times it was repinned and how many likes it received. One of the most important pieces of information I can find quickly and easily is if we have gotten any comments on our own content. Responding to these comments is a great opportunity to network with other pinners which can result in new page views and followers for our site.
Hang in there, we are almost done. The next piece of critical data is knowing when the best times are to pin content to our account. We had been pinning between the hours of 7am to 11pm since we started Pinterest. When I shared our pinning schedule with another blogger Dan Ashbach (he has 1.6 million followers) here is what he told me: “Tracy the world wakes up at 1am”! We had been missing some of our best pinning opportunities because we only pinned content between 7am and 11pm.
On the diagram above the circles represent the amount of pins pinned in that hour. The larger the circle the more content was pinned in that time frame. The darker green color represents higher engagemnt and higher repins.
Hovering over any of the dots on the diagram brings up the box below which shows you how many pins and repins happened in that one hour time period.
We extended our pinning schedule to a 24 hour time period, changing the times we pinned based on how viral each time frame turned out to be. By pinning in the optimal time frames, we experienced another sizable surge in new followers. We had no idea that Sunday at 12am, Saturday at 5am and 11:30pm , Wednesday’s at 6am, and Friday nights at 7:30pm would be some of the best times to pin our content.
Tailwind has taken the guess work out of growing our Pinterest account. Using the information and tools above has given us the ability to use a very specific and targeted pinning strategy. Our goal is not just gaining new followers, but gaining followers who are highly engaged by our content. These engaged followers are more likely to repin our content, visit our site and become loyal followers of our blog and Pinterest account.We currently have 50,315 followers, our next goal is to have 150,000 followers by the end of 2014. Increasing our followers to 150,000 the next 7 months may seem overly optimistic to some people. Based on the results we have had so far with Tailwind we feel our goal is high but attainable.
It’s easy to see why we think that Tailwinds Pinterest Analytics……
Totally Rock!





Ahhh I have to win this! I’m just itching to see all these amazing analytics.
Crossing my fingers for you Katie!!!
WooHoo!! That’s me. I am sooo excited about this! Thank-you ladies for such an awesome giveaway. Can’t wait to learn how to use Tailwind. Thanks again!